E-Commerce Playbook
Streamline E-commerce Success
Data analytics is changing the way Ecommerce companies operate and work. Data-driven decisions bring in more revenue, helps in understanding customer patterns and behavior, quantifies the customer value and forecasts potential opportunities.
Why?
Data is available for each and every move a customer takes from the time he browses a product to the time he provides feedback. This is both good and bad! The huge volume of data can be a challenge because determining what is important from it can be time-consuming. However, processing and analyzing it the right way could bring out insights that will help the company stay ahead of the competition.
Here is a list of dashboards that cover this entire domain divided by categories:
These dashboards help in monitoring the marketing performance of the companies, thus giving a clear understanding of where the company stands and how it should proceed in future. With the increase in importance of inbound marketing, more focus has been given on social media and email marketing, and website analysis. A dashboard on marketing mix has also been included to get an overall picture. These reports could help the marketing managers to decide on which area to focus while planning the future strategies. It could also help them in stopping/eliminating the spend on channels which are not profitable.
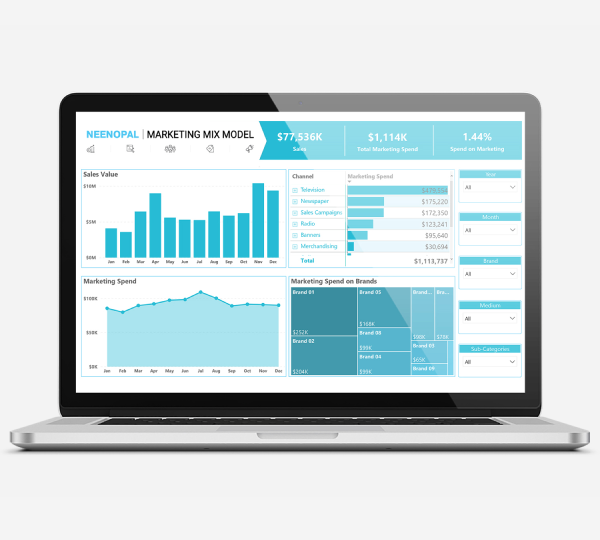
Marketing-Mix-Modeling
How is the return on current marketing spend? How to plan the next budget?
This dashboard contains the complete end-to-end information required to plan a marketing budget and forecast its impact on sales and most importantly, the ROI. It also lets the business analyze where it went wrong with its current marketing strategy. The simulation part of the dashboard helps businesses predict the future return due to their spending on various channels. This is crucial for decision making. The dashboard answers the below questions:
1. How is the return on the current marketing investments?
2. How does change in budget impact sales?
3. Which sectors is the company overspending/ underspending?
4. How profitable is the company over the year?
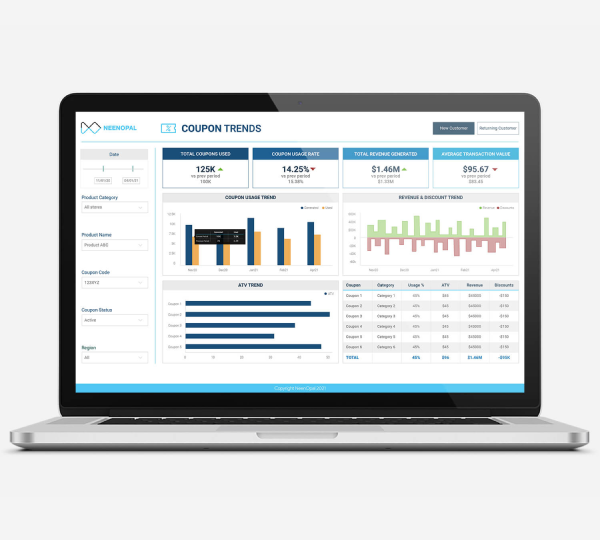
Coupon Trends Analysis
How are the coupons performing? Is the current trend good?
The Coupons dashboard monitors the performance of coupons – an important marketing tool for the Ecommerce companies. It helps in analysing the effectiveness of the current coupon strategy, thereby providing insights for making future plans. It also tries to identify opportunities for the business to increase sales by attracting more customers.The Coupons dashboard answers the below questions:
1. Is the current coupon strategy successful?
2. Is Couponing growing or slowing?
3. Which coupon is doing the best?
4. Is the discount given too much or too little?
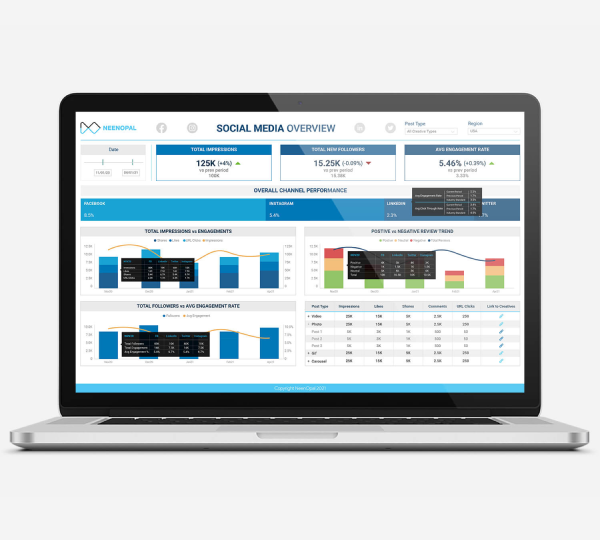
Social Media Marketing Analysis
How is the current online presence of the company?
Social Media has become one of the most powerful mediums for businesses to connect with the audience to build their brand, increase the sales, and drive website traffic. In recent days, social media and other inbound marketing techniques have grown to occupy a large chunk of the marketing plans of the company. The Social Media dashboard has the following three views:
1. The Overview dashboard gives an overview of the current social media presence of the company.
2. The Conversions dashboard tracks how user interest gets converted to transactions and generates revenue.
3. The Customer insights dashboard provides insights that help in identifying the preferences of the target audience.
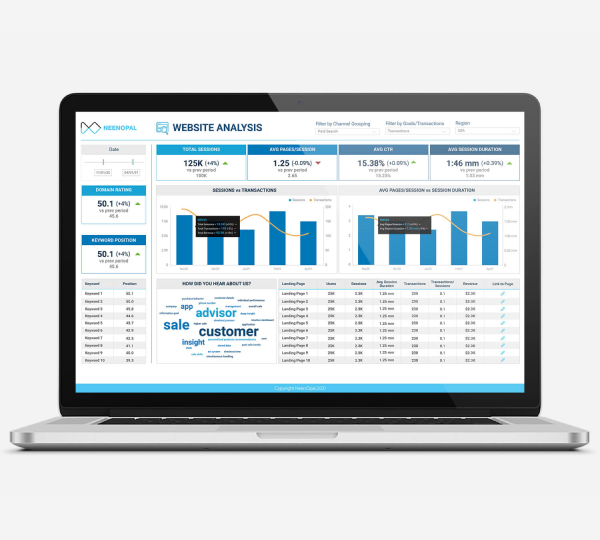
Website Analysis
How is the current website traffic and conversion rate?
The website analysis dashboard helps businesses monitor the traffic and talks about the KPIs that decide the success of current online marketing strategy. It answers the below questions:
1. Source - From where did leads hear about us - the path of traffic?
2. Which are the top keywords?
3. The Customer insights dashboard provides insights that help in identifying the preferences of the target audience.
4. Are the ad campaigns effective? What about Industry competitiveness?
5. Is the customer happy with the website – design and content?
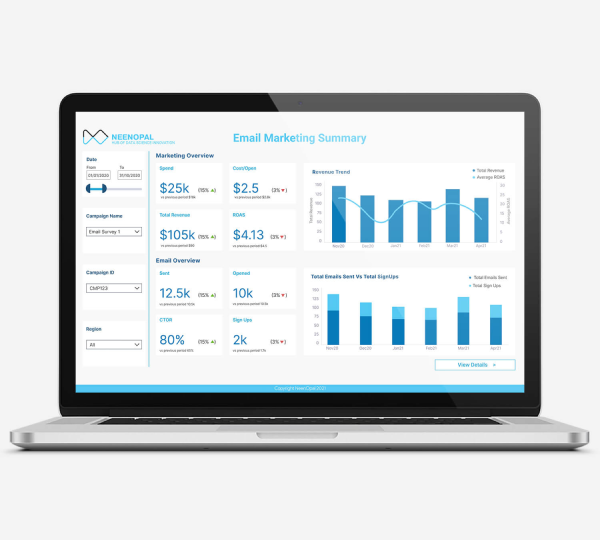
Email Marketing Analysis
How is the current performance of the email channel?
Emails are one of the most cost effective marketing tools that allow the business to connect personally with their target audience. This dashboard compares the current email campaigns of the business to draw insights that could help them plan better strategies for the future. It answers the following questions:
1. Does the email design and content resonate with the audience?
2. How much revenue does email campaigns generate?
3. Is the current cost of campaigns acceptable?
4. Which campaigns are performing the best?
5. Has the total number of subscribers increased with time?
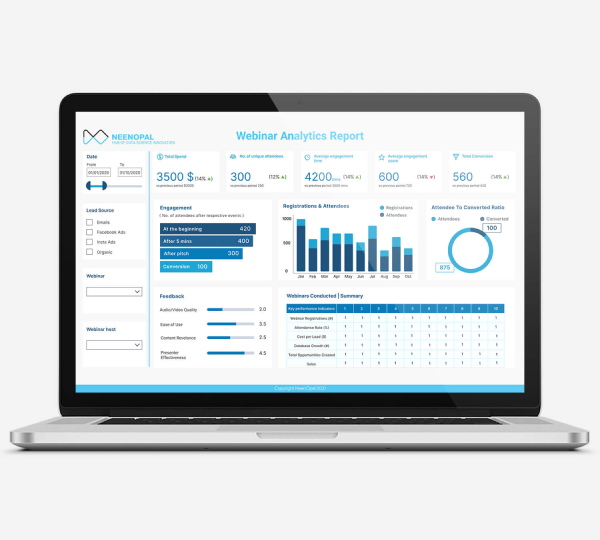
Webinar Analytics Report
Has the webinars been effective in lead generation and business growth?
Webinars have become a key part of the marketing strategy toolkit. They are said to be the best way to engage the audience. The dashboard includes various KPIs to measure the impact of webinars on the business. It answers the below questions:
1. How many people registered for/ attended the webinars?
2. How many new customers were acquired as a result of the webinar?
3. Were the webinars successful in retaining audience?
4. How effective were the webinars conducted over the time period?
5. Did the attendees enjoy the webinar?